When it comes to dividing up the pie, every year Americans are left fighting over fewer and fewer crumbs. This was not an inevitable consequence of globalization. It was a political choice.

Labor Day is an opportunity to reflect on the contributions of American workers to the economy and to the society that economy serves. Thanks to hard-fought battles won by the labor movement, once-controversial issues like child labor, worker safety, or the 40-hour work week are now enshrined into law.
Sadly, over the last four decades the bargain that was struck between workers and economy has been broken. The American economy has never been more productive. Yet more and more working Americans are falling into poverty as wages stagnate, meanwhile the cost of housing and other basic necessities goes up.
This dismal state of affairs isn’t just a burden on American families. Of course, it puts a drag on our economy when low wages reduce demand for consumer goods. But it is the fiscal consequences of rising inequality that is perhaps the most perverse consequence of all. Part 5 of The Bargain revealed how a big chunk of our national debt is a result of the higher costs associated with providing government services to impoverished citizens.
The wealthiest country on earth suffers such high rates of poverty and can’t even pay the full bill for its government services year after year.
How did it come to pass that the wealthiest country on earth suffers such high rates of poverty and can’t even pay the full bill for its government services year after year? Before we turn to this last, biggest question, let’s take a moment to review where we’ve been and what we’ve learned.
This was the graph that set me on a journey to discover why Americans don’t have nice things like universal healthcare or affordable college.
Before I saw this graph, I assumed that Americans just didn’t pay as much in taxes as our peers in other wealthy countries. And what we do pay must go mostly to defense spending rather than social programs or basic services. At least, that’s what I thought going in.
I’ve spent the last several months piecing together the receipts. Every time I found one, it only seemed to raise bigger, deeper questions. At long last, here are six answers that I have taken away from this effort to better understand the bargain between government and society in America:
1. The American taxpayer is definitely getting ripped off.
If you total up all federal, state, and local government spending, the US spends as much per person as more generous welfare states in other wealthy countries. It isn’t that Americans don’t pay enough in taxes. It’s that we don’t have as much to show for it.
2. It’s not all about defense spending.
America spends more on defense than all other wealthy countries combined. But when you break down government spending, defense expenditures are dwarfed by our public spending on healthcare. We outspend even the most generous welfare states on healthcare. This is true whether you add it up on a per capita basis, or as a percentage of total government expenditures.
Part 2: Here Are The Receipts, Cardi
3. The biggest casualty of all this public spending on healthcare and defense is America’s social safety net.
We spend far less on social protection programs like unemployment insurance or poverty relief than other wealthy countries. This leaves everyday Americans more vulnerable in the face of inevitable accidents, misfortune, or the sometimes destructive churn of markets. (Part 2)
4. For all this public spending on healthcare, Americans don’t have much to show for it.
We have the lowest life expectancy among wealthy countries. In part this is because Americans lack universal coverage and access to preventative medicine. This, despite the fact that we spend more per person on health care than social democracies like Sweden or the UK.
Given the lack of universal care and the high costs of treatment under our health care system, it is no surprise that private medical expenses are the leading cause of individual bankruptcy in America.
Part 4: Why National Wealth Doesn’t Buy National Health
5. Inequality is the silent killer.
While our health care system is part of the problem (Part 4), the root cause of America’s fiscal crisis is economic inequality. Poverty remains the best predictor of adult onset diabetes, as well as the handful of other expensive but preventable illnesses that drive up public healthcare spending and drive down life expectancy. Treating these preventable illnesses is a big drain on the public treasury, contributing significantly to the national debt. It turns out that governing a society is much more expensive when it is beset by poverty.
Part 5: Inequality is Fiscally Irresponsible
So income inequality got us into this mess. How did we wind up so unequal? If the graph above was the alpha–the nagging fact that started me on this journey to better understand America’s bargain–then this graph marks something of an omega.
So income inequality got us into this mess. How did we wind up so unequal?
In 1980, the bottom half of American workers brought home 20.7 percent of all income the economy generated that year — about 1-in-5 dollars.1 By comparison, the top 1% of all income earners captured 10.7 percent of the total in 1980—about 1 out of every 10 dollars. Still good money for the One Percenters, but a far cry from what we see today.
By 2016, those distributions had become nearly inverted. The bottom half of American workers brought home only 13.1 percent of total national income, compared to more than 20 percent in 1980. Now it is the top 1% who bring home 1 out of every 5 of the dollars that the US economy generates every year.
Now it is the top 1% who bring home 1 out of every 5 of the dollars that the US economy generates every year.
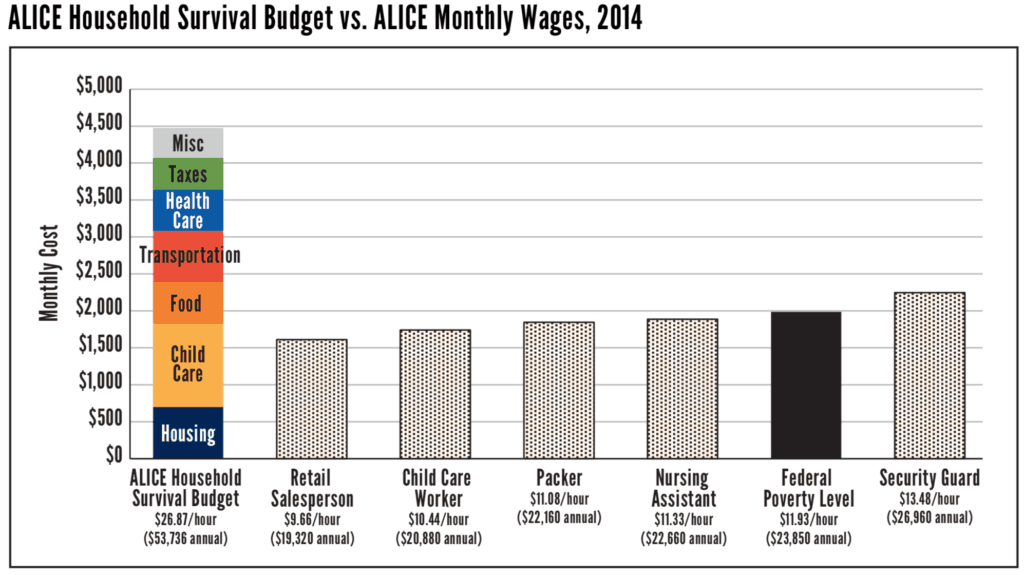
One consequence of this inversion in America’s income distribution is that more and more working families are unable to make ends meet. According to figures from United Way’s project ALICE (Asset Limited, Income Constrained, Employed), 43 percent of working households can’t afford basic necessities each month.2

If you add up average spending on housing, child care, food, transportation, health care, and miscellaneous expenses in America, the Survival Budget for a family of four comes to $4,729 per month. For those American families in the bottom half of the income distribution, one full-time job just doesn’t cut it anymore.
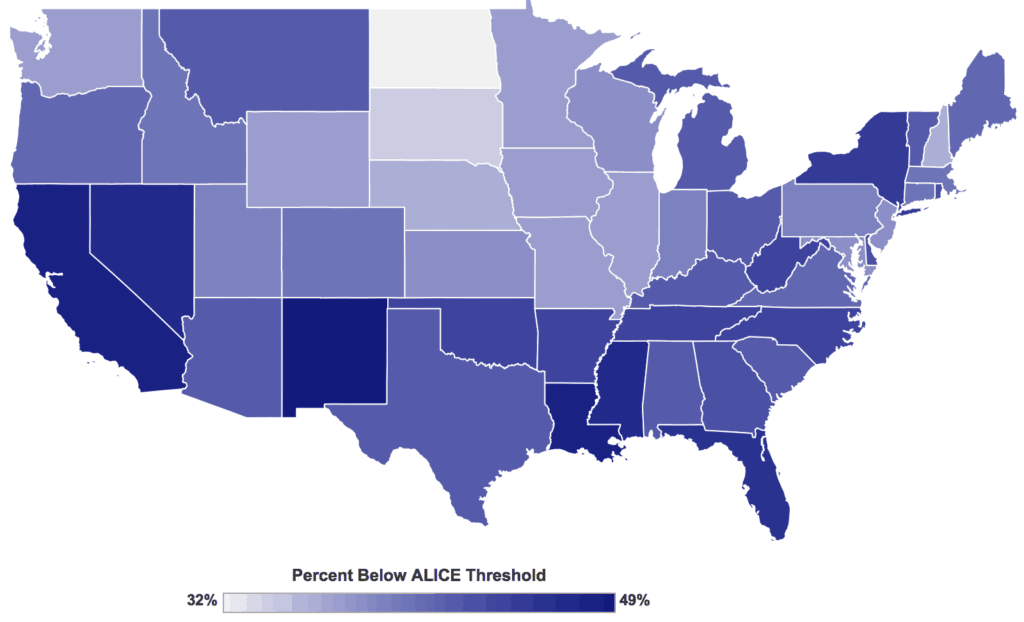
Where do these ALICE families live? In short, everywhere. Not surprisingly, many are concentrated in America’s rust belt and across the American South. These are areas where farming and manufacturing jobs have been hardest hit by global trade and technological change. Yet, many of the greatest concentrations of struggling families are in places like New York and California–tech-heavy regions that have gained the most under globalization.
Percent of households in each state that live below the ALICE Threshold, 2016

Click here for an interactive version of this map with state- and county-level figures.
Unevenness in the distribution of ALICE families helps us see where the winners and losers are among American workers. But what is really striking is that nowhere in America do more than two-thirds of working households manage to rise above the minimum Survival Budget. In the richest country in the world, tens of millions of full-time workers are still fighting to make it to the end of the month.
It is an inescapable fact that 13.1 percent simply isn’t a big enough slice of the national pie to go around for the bottom half of our workers.
Whatever mix of market forces contributed to this outcome, it is an inescapable fact that 13.1 percent simply isn’t a big enough slice of the national pie to go around for the bottom half of our workers.
6. It didn’t have to be this way.
If we compare the distribution of US income that we saw above against Western Europe’s, we see that there was nothing inevitable about this level of inequality. The countries of Western Europe have experienced the same changes in technology that drive work automation in American factories. Their economies have become even more integrated with China through trade than they are with the US.3 And yet, Western Europe has managed to discipline these market forces in such a way as to prevent the same concentration of income in the hands of the top 1%.
While the distribution of national income in the US was undergoing its inversion over the past 40 years, the split between the bottom half and the top 1% has remained relatively constant across Western Europe. In 1980 the bottom half there received 23.7 percent of all national income, compared to 21.7 percent in 2016. Similarly, the share captured by the top 1% only rose from 10 to 12.2 percent over the same period.
All together now.
Inequality in America was not an inevitable consequence of globalization. It was a political choice.
Many blame China or Mexico for for the desperate lot of the American worker. These data show that, while the economic crisis facing working Americans is real, the true villain was not free trade or migrant workers. Rising inequality is the result of a political failure by the US government to manage the rising tide of the economy so that all boats rise with it. When you compare how the US divides up the national pie each year with how Western European countries do, it is clear that the shriveling of the American Dream is a homegrown crisis.
When you compare the US with Western Europe, it is clear that the shriveling of the American Dream is a homegrown crisis.
Where do we go from here? How do we prevent our society from becoming even more carved up into haves and have-nots? One important lesson from the data is the need to get the costs of health care under control. This would free up more public resources to dedicate towards America’s social safety net. After all, even the best-managed economy will still require us to protect American workers when hard times set in. Another related lesson is the need to re-invent trade adjustment assistance (TAA) so that it is equal to the measure of the crisis facing our trade-impacted regions.
One more lesson is the need to return to a progressive income tax–one that asks those who profit most from our economy to shoulder a more equitable share of the burden for maintaining it. When Ronald Reagan took office in 1981 the marginal tax rate for our top income bracket was 70 percent. By the time he left office in 1988, it had been slashed to 28 percent. Our tax code has never recovered.
There are more radical solutions on the horizon. The Green New Deal is an aspirational document that envisions an aggressive, sustainable national industrial policy–one that is balanced to push against regional decline in America’s many rust belts and rural areas. Just how green that industrial policy should be is up for debate. But there is growing consensus on both sides of the aisle that the US government must play a bigger role in promoting economic innovation.
Another radical solution is the idea of a universal basic income (UBI), such as the $1,000 per month Freedom Dividend championed by Democratic presidential hopeful Andrew Yang. By raising the income floor by $12,000 per year, America could provide its workers with a living wage without resorting to minimum wage laws that do not account for regional labor market dynamics–especially disparities in the cost of living.
No one policy can reverse America’s crisis of economic inequality, or the national debt crisis that has grown out of it. But what is clear is that the social democracies of Western Europe have been far more effective at managing the same global forces. Their strategies vary widely from country to country, and none of these societies has managed to prevent rising inequality entirely.4 Yet, where they do succeed, Americans can learn something from these other wealthy countries about how to govern markets in such a way as to ensure that hard work always pays. That is, after all, a founding principle of the American Dream.
Notes
- A hat tip to Umair Haque at Eudaimonia and Co for his reporting on this data, and his coverage of economic injustice more broadly.
- www.unitedforalice.org/national-comparison
- “In most years, Eurasian trade amounts to nearly three times the volume of transatlantic trade.“
- https://voxeu.org/article/forty-years-inequality-europe


